

Forward Future Tools Library

ToDiagram
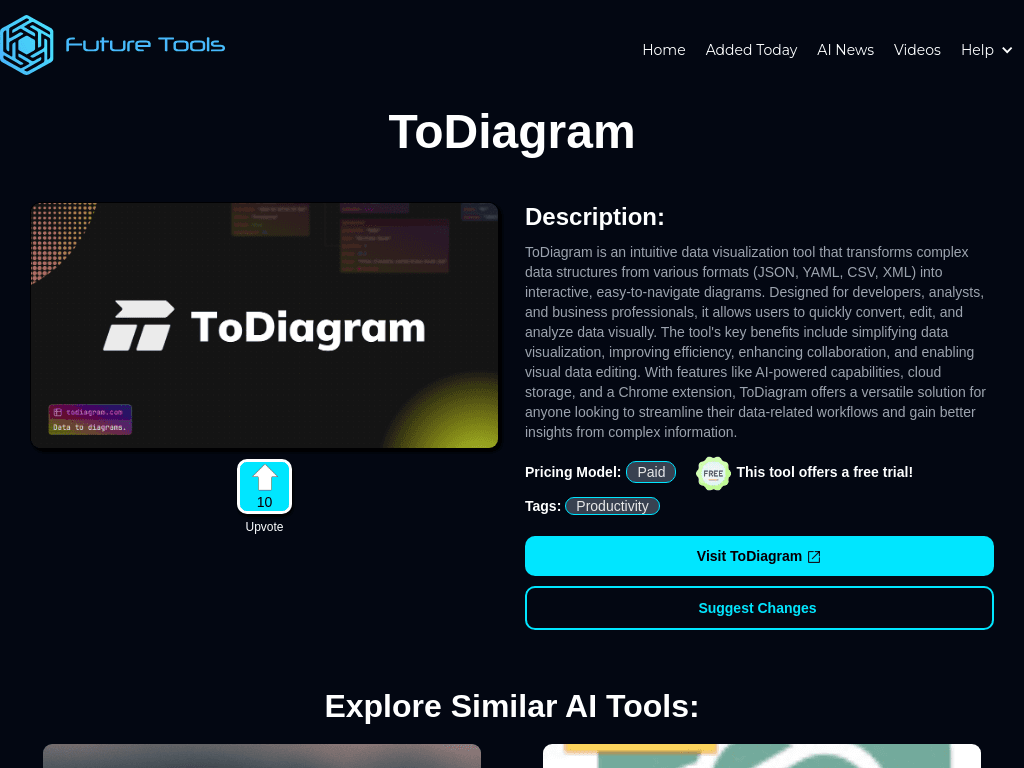
ToDiagram converts structured data such as JSON, YAML, CSV, and XML into interactive diagrams for developers, analysts, architects, and product managers.
Try ToDiagram →
futuretools.io·Freemium


›What is ToDiagram?
ToDiagram is a web-based data visualization tool that parses structured data and renders it as interactive diagrams. Users can inspect and edit JSON, YAML, CSV, XML, and Mermaid inputs, adjust layouts, and annotate visual elements. It also offers cloud storage, a Chrome extension, and MCP integration.
›What are the pros and cons of ToDiagram?
Strengths
Accepts several structured data formats instead of requiring diagrams to be drawn manually
Interactive editing lets users adjust nodes and layouts after parsing
Client-side privacy is available for inspecting structured data
Users can start pasting data without signing up
Chrome extension and MCP integration provide additional entry points
Trade-offs
The free use limit is reported as three diagrams
There is no on-premise or self-hosted deployment option
It is not intended for complex UML or SysML diagrams beyond basic Mermaid support
The tool is less suitable for general flowcharts that do not begin with structured data
›What are ToDiagram’s key features?
Converts JSON, YAML, CSV, XML, and Mermaid input into interactive diagrams
Supports visual editing of nodes, layouts, and annotations
Renders flowcharts, mind maps, network graphs, and organizational charts
Exports diagrams as PNG, SVG, or PDF
Provides Chrome extension and MCP integration
Offers real-time collaboration and cloud storage
›What are the best use cases for ToDiagram?
Inspecting API responses and webhook payloads during development
Exploring CSV columns or JSON structures before designing schemas and queries
Visualizing network or system configurations from JSON and YAML files
Documenting API interactions and data flows
Creating editable diagrams for presentations and team review
›What is the pricing for ToDiagram?
Freemium
›Who is ToDiagram best for?
developersA strong fit for quickly inspecting JSON, YAML, API responses, and webhook payloads.
data analystsUseful for exploring CSV and JSON structures visually before building queries or schemas.
architectsWorks well for turning structured configuration data into network or system diagrams.
product managersHelpful for documenting API interactions and data flows in editable diagrams.
Not for
- Teams that require on-premise or self-hosted deployment should skip it because no such option is available.
- Users creating complex UML or SysML diagrams should choose a tool built for those diagram standards.
- Users who need a general-purpose flowchart editor without structured data input may find the workflow restrictive.