

Forward Future Tools Library

CalcGen
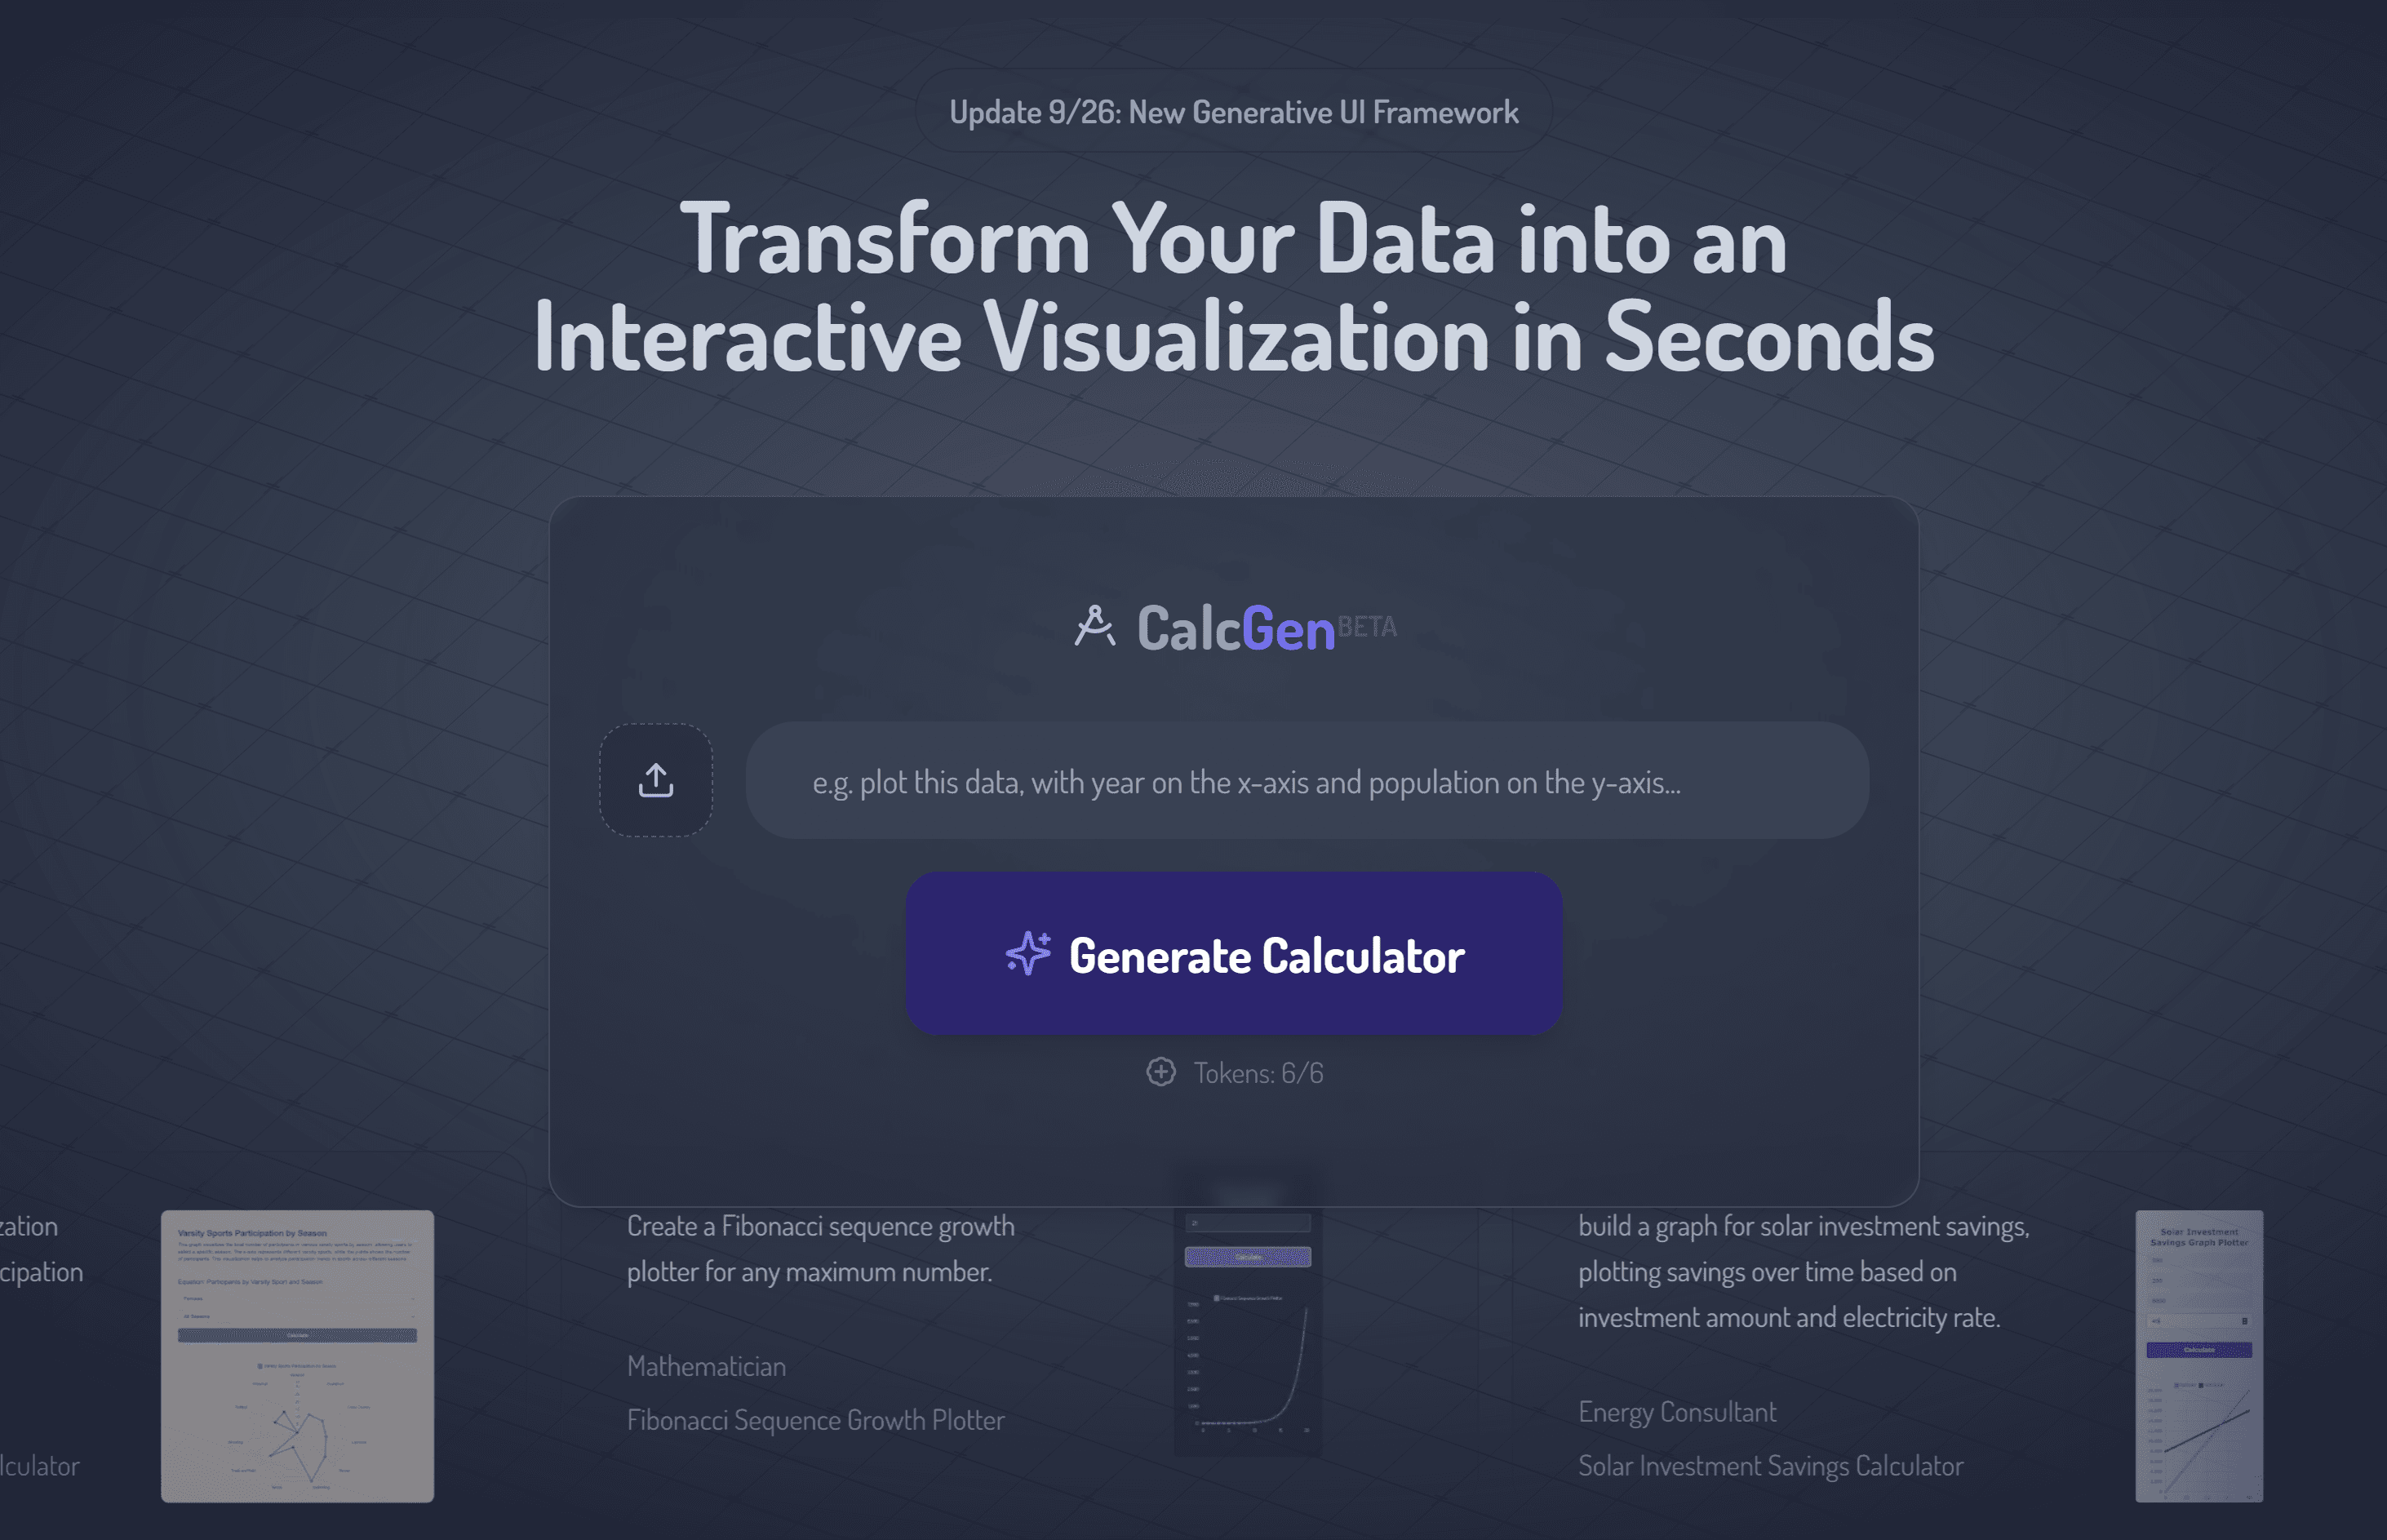
CalcGen turns prompts or data tables into interactive charts, graphs, and calculators for analysts, educators, marketers, and professionals who need presentation-ready visuals.
Try CalcGen →
calcgen.ai·From $9.99/mo·Checked 2026-09-02



›What is CalcGen?
CalcGen is a web-based AI tool for creating interactive charts, graphs, calculators, and data visualizations from plain-language prompts or user data. Its agents can research online sources, analyze and clean data, generate titles and summaries, and build customizable visuals. Results can be embedded in Notion, PowerPoint, WordPress, Wix, and Miro.
›What are the pros and cons of CalcGen?
Strengths
Turns plain-language requests into interactive charts and calculators without requiring code
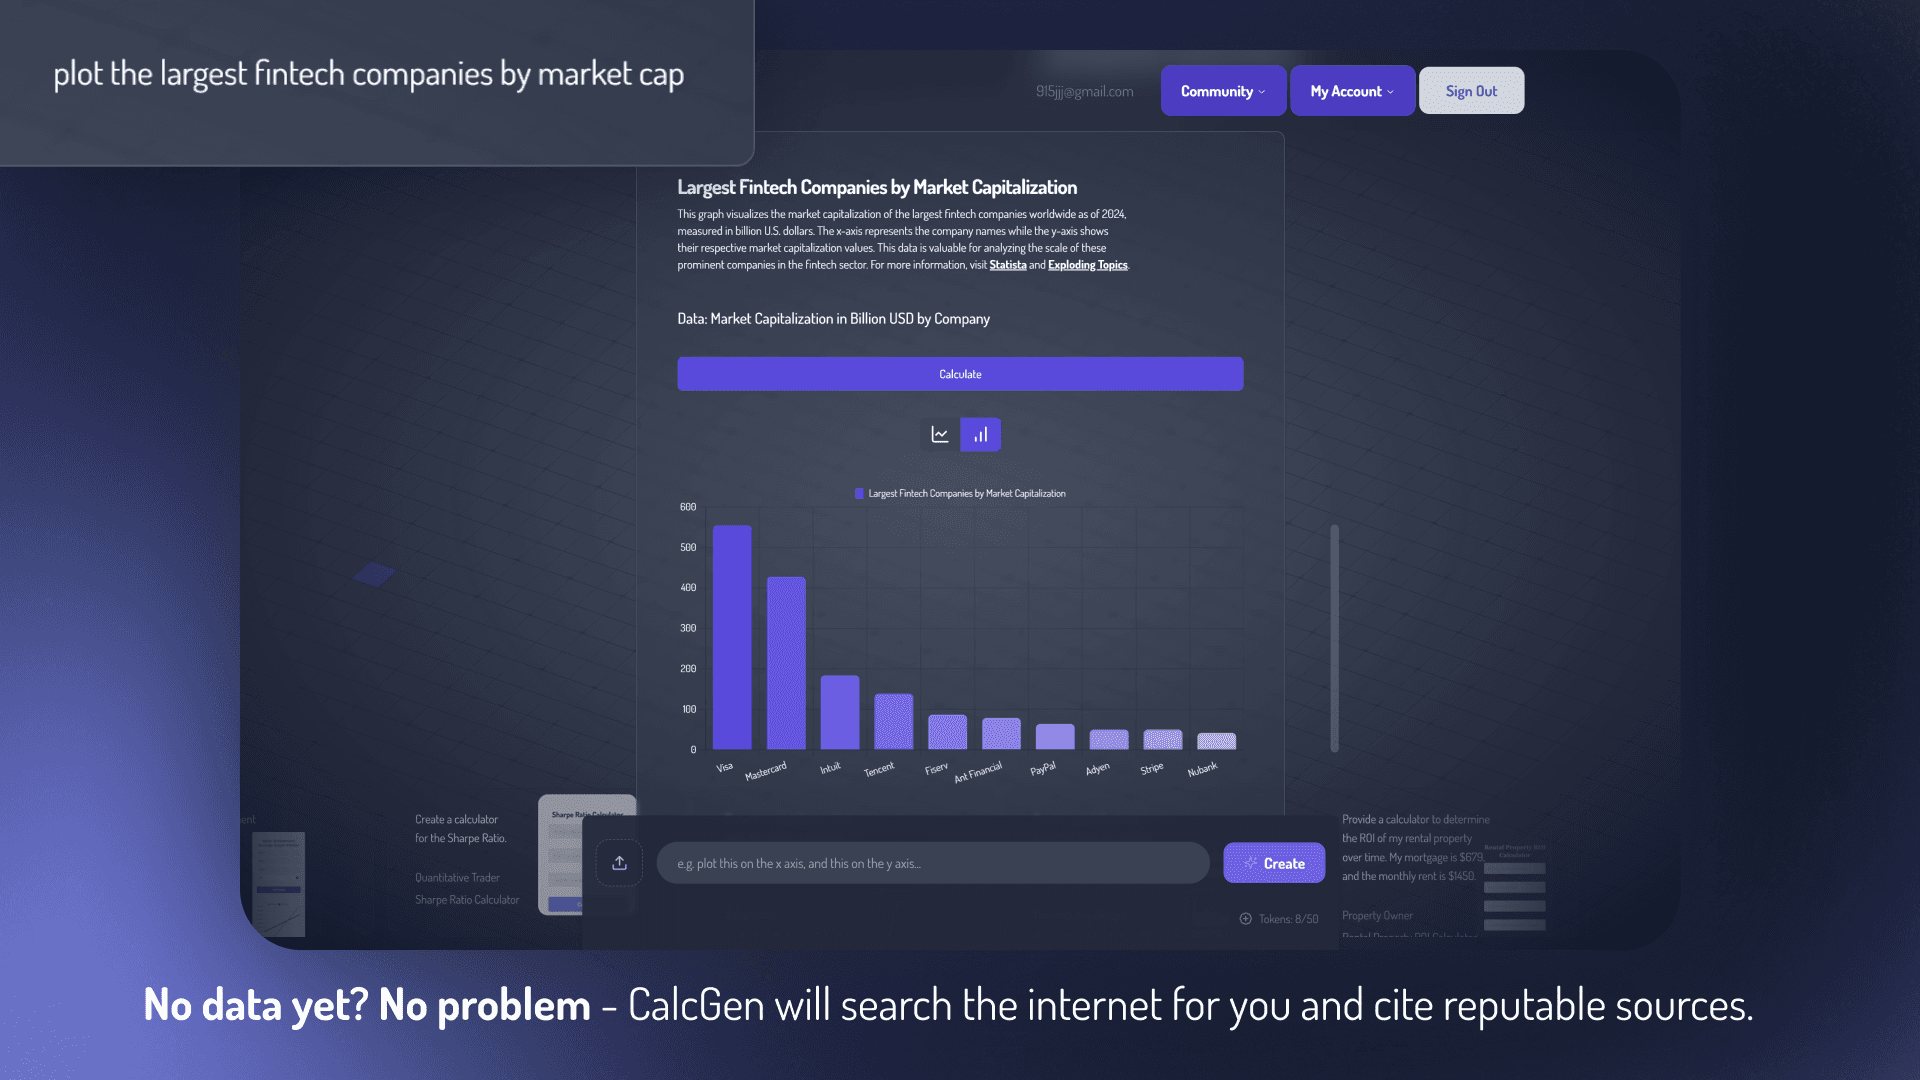
Can research data online and attach source links to the resulting visualization
Offers visual customization through themes, chart types, filters, and sorting
Supports embedding in several presentation, publishing, and collaboration platforms
Covers specialized financial, scientific, demographic, and business calculations
Trade-offs
The product is labeled BETA
A tutorial recommends keeping datasets below 150 points for best results
The official pricing page does not display plan details while loading
›What are CalcGen’s key features?
Creates charts, graphs, and calculators from natural-language prompts
Uses a search agent to find online data and link sources to visualizations
Generates chart titles and data summaries through an analysis agent
Supports chart types, filters, sorting options, themes, and editable descriptions
Creates specialized calculators for finance, science, demographics, engineering, and business estimates
Embeds interactive visuals in Notion, PowerPoint, WordPress, Wix, and Miro
›What are the best use cases for CalcGen?
Plot financial performance across revenue, expenses, profit, or other metrics
Build calculators for compound interest, Sharpe ratios, rental property ROI, or solar investment savings
Compare population, sports participation, vehicle prices, or film earnings over time
Create scientific and engineering calculators for formulas such as the ideal gas law and Bernoulli equation
Generate quote estimators for businesses such as roofing contractors
Prepare interactive visuals for presentations, teaching materials, or published content
›What is the pricing for CalcGen?
| Plan | Price | Details |
|---|---|---|
| Student/Small Business | $9.99/mo | Plan for students and small businesses. |
| Scholar/Developer/Teacher/Business | $19.99/mo | Plan for scholars, developers, teachers, and businesses. |
| Enterprise | Contact us | Enterprise pricing is provided on request. |
Checked 2026-09-02 · source
›Who is CalcGen best for?
data analystsUseful for turning a prompt or data table into an interactive visual without manually formatting charts.
educatorsWorks well for creating teaching visuals and formula-based calculators across science, mathematics, and demographics.
marketersA practical option for producing customizable visuals that can be embedded in publishing and presentation tools.
finance professionalsSupports financial performance charts, compound interest, Sharpe ratio, ROI, and investment-savings calculators.
Not for
- Teams working primarily with datasets above 150 points may find the recommended dataset size restrictive.
- Buyers who require a mature, non-beta product should consider its current BETA status.
›What are the best CalcGen alternatives?
 JuliusChoose this instead if your main need is chatting with files for analysis rather than generating embedded interactive visuals.→
 GPTExcelChoose this instead if you need spreadsheet formulas, SQL queries, automation scripts, or regex generation.→
 PerplexityChoose this instead if deep web research and agentic search are more important than building charts and calculators.→
 Kensho→